
Real-world Results
Explore how utilities and operators around the world use PowerTwinX to solve complex grid challenges and achieve measurable KPIs.
National Grid Optimization
Challenge
High technical losses and unpredictable congestion during peak renewable generation.
Solution
Deployed PowerTwinX for live power-flow simulation, congestion analysis, and dynamic rerouting.
Implementation
Digital mapping with SCADA and operational-data integration.

Key Results & KPIs
*Illustrative PowerTwinX deployment targets — replace with validated customer results when available.
Smarter Feeder Management
Challenge
Limited visibility across distribution feeders caused voltage instability, inefficient asset utilisation, and delayed identification of network losses.
Solution
PowerTwinX created a live digital representation of the distribution network to analyse power flows, identify anomalies, and optimise feeder operations.
Implementation
Integrated GIS, smart-meter, SCADA, and feeder data into the PowerTwinX digital twin.
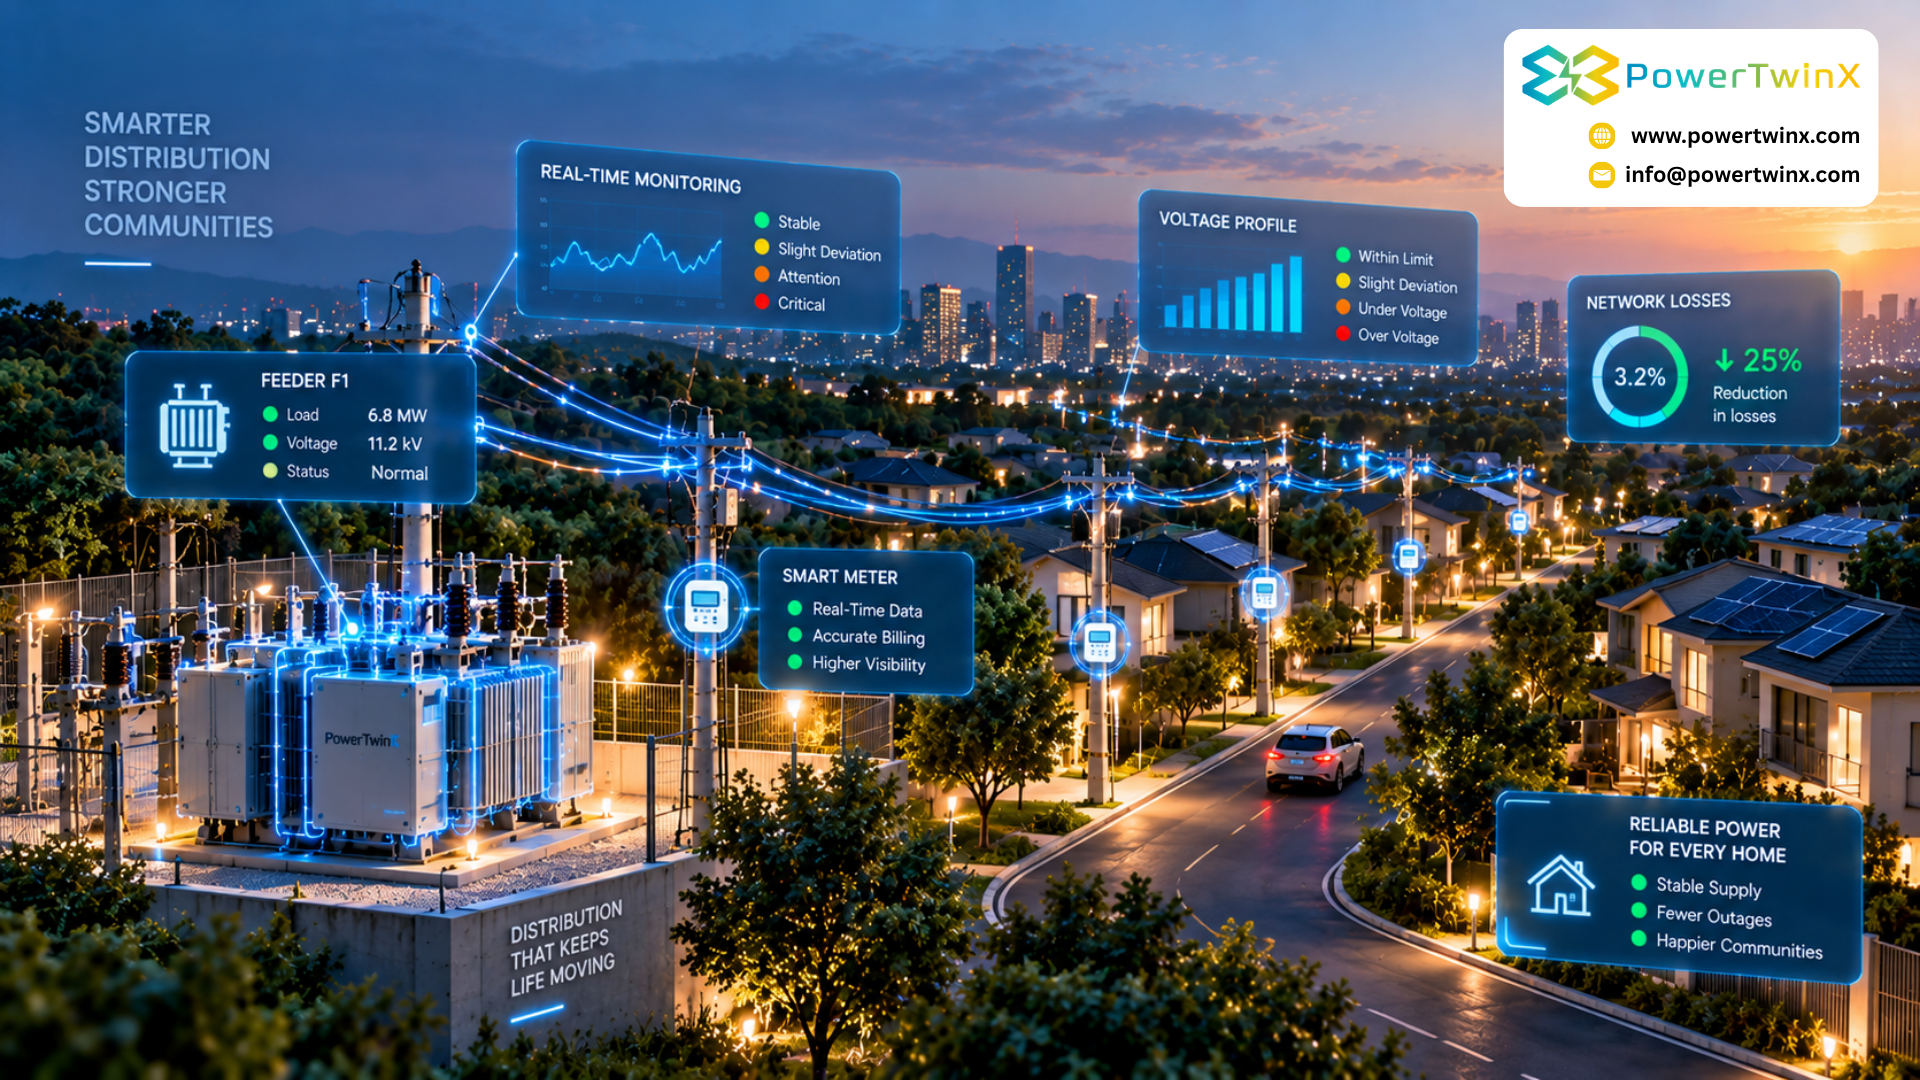
Key Results & KPIs
*Illustrative PowerTwinX targets. This one is particularly well-grounded in real-world digital-twin applications. An IEA-supported Indian distribution-grid project used smart meters and sensors across 23 feeders and digital-twin models to analyse losses, load profiles, and voltage quality. It reported improved asset utilisation, more accurate energy measurement, and better visibility.
Renewable Generation Optimization
Challenge
Variable solar and wind generation creates unpredictable power flows, increasing the risk of curtailment and making grid balancing more difficult.
Solution
PowerTwinX simulates renewable-generation scenarios, forecasts system behaviour, and identifies optimal operating strategies before changes are implemented.
Implementation
Connected generation data, weather inputs, network conditions, and operational models within the PowerTwinX environment.
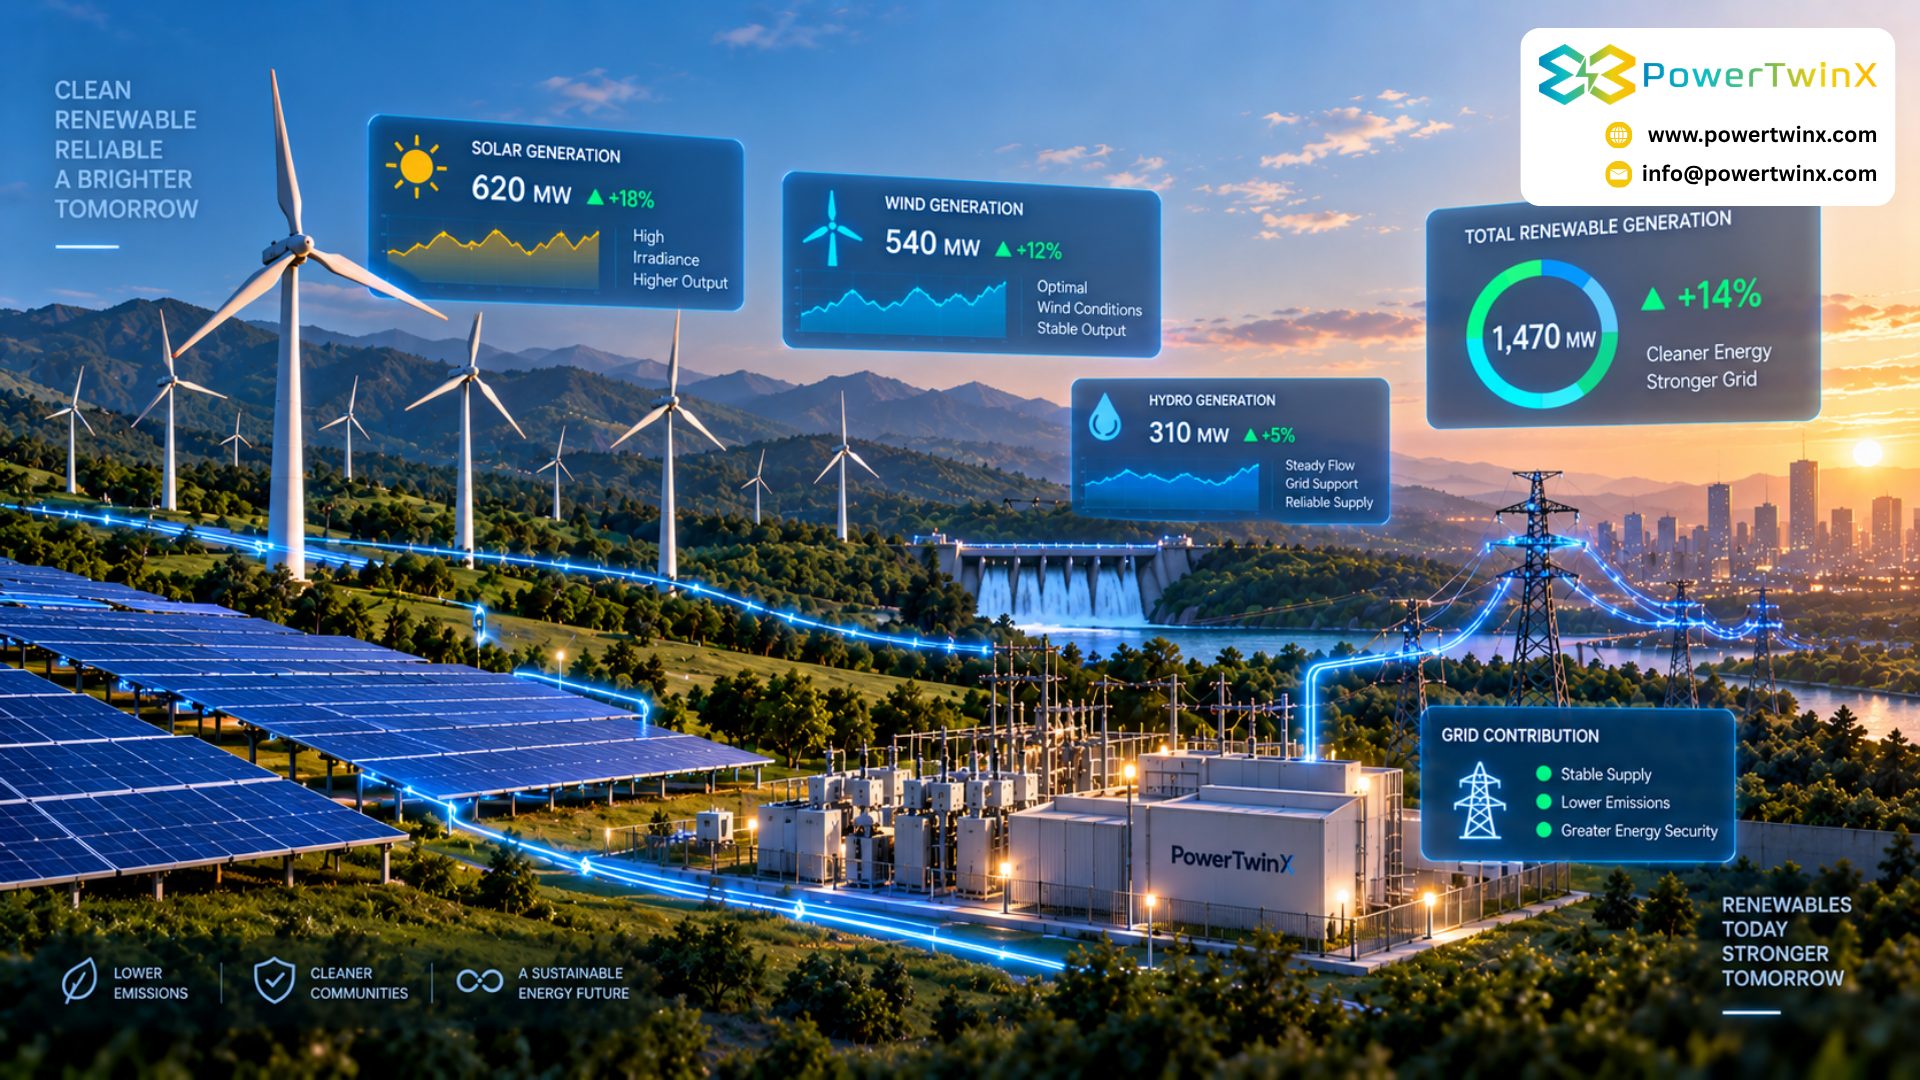
Key Results & KPIs
*Illustrative PowerTwinX targets. There is strong research support for this type of application: a UK smart-energy-network digital-twin demonstrator estimated that voltage-control strategies could reduce solar curtailment by 56% for an exemplar day.
Predictive Asset Management
Challenge
Reactive maintenance can result in unexpected failures, costly downtime, and unnecessary field inspections.
Solution
PowerTwinX creates a digital representation of critical assets and continuously analyses operational behaviour to identify deviations and potential failure conditions.
Implementation
Combined asset data, sensor information, historical performance, and predictive models within the digital twin.
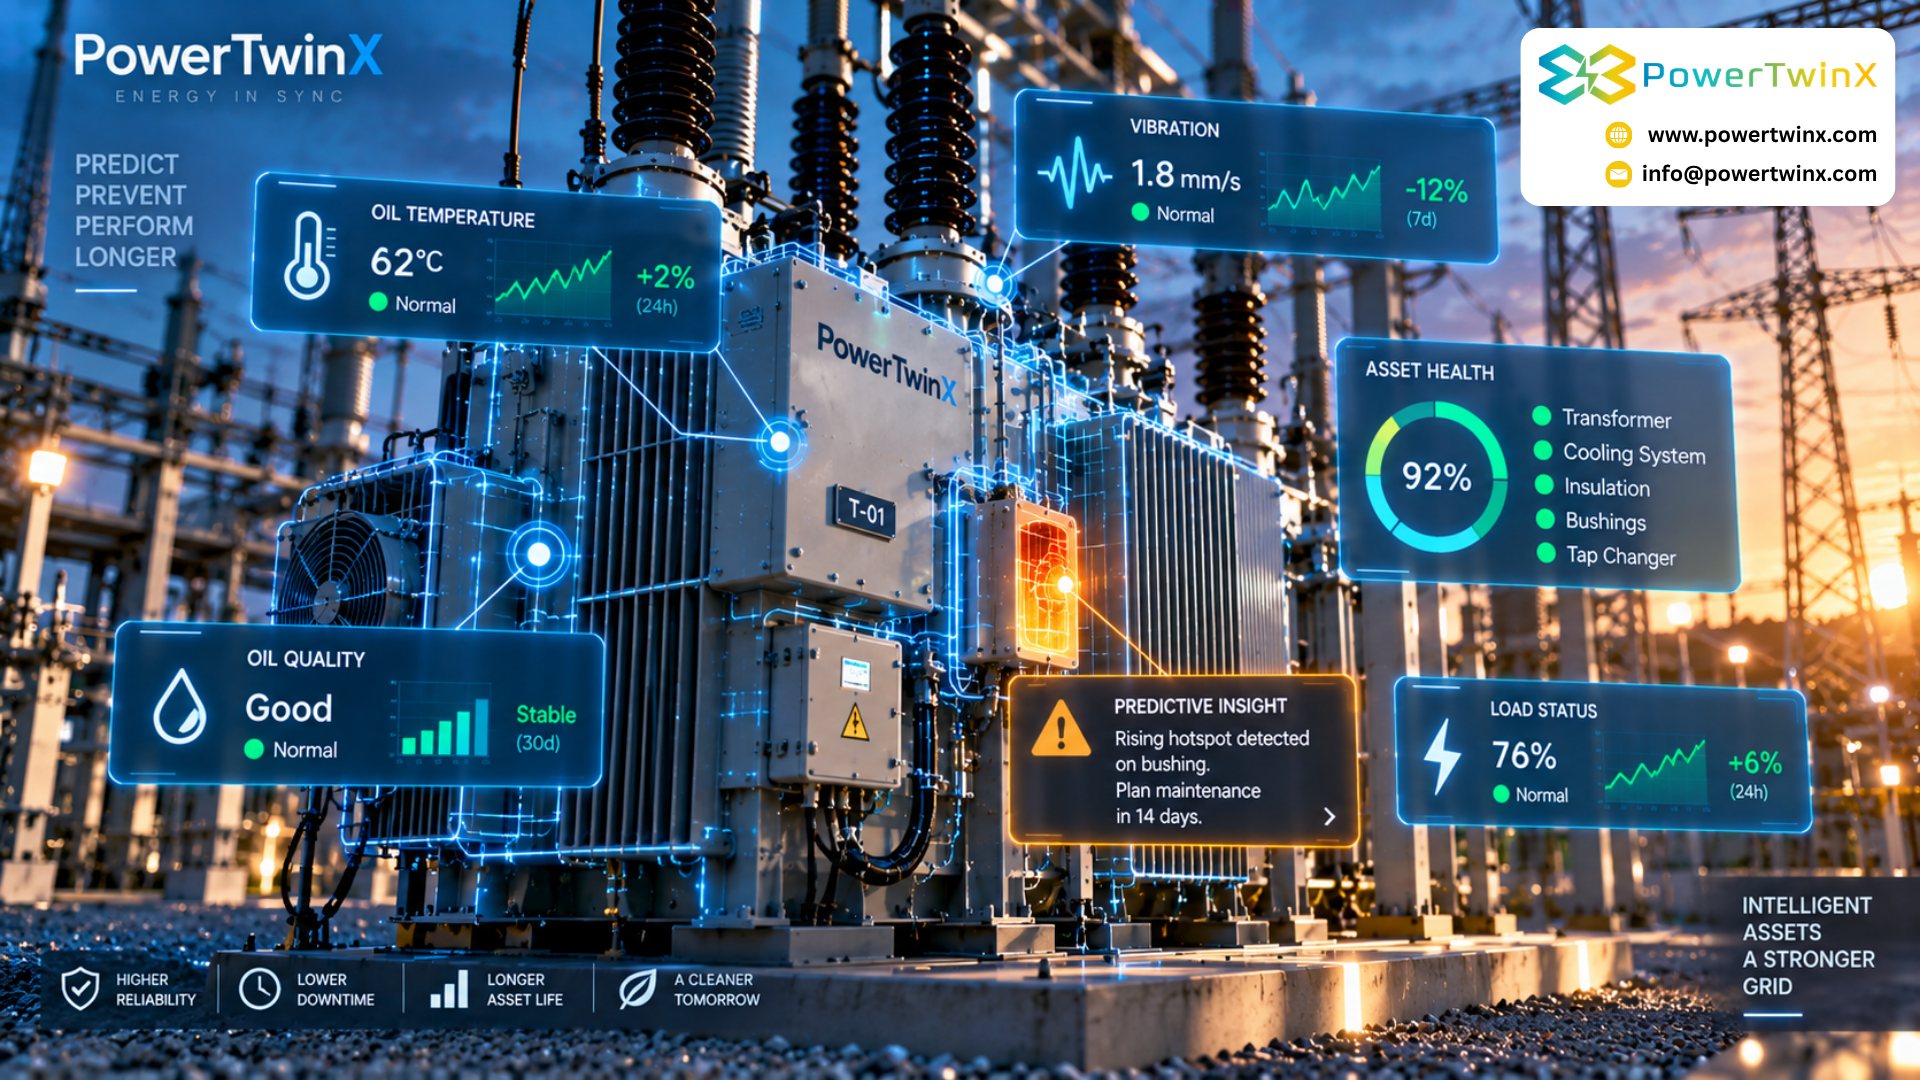
Key Results & KPIs
*Illustrative PowerTwinX targets. This direction is also supported by current digital-twin research, which identifies predictive maintenance, fault detection, scenario simulation, and operational optimisation as major power-system applications.
Intelligent Energy Optimization
Challenge
Large energy consumers often lack a unified view of where, when, and why energy is being consumed, making optimisation reactive rather than continuous.
Solution
PowerTwinX builds a digital view of energy consumption across connected systems, identifying inefficient patterns and opportunities for intelligent load optimisation.
Implementation
Connected real-time consumption data, equipment behaviour, operational schedules, and optimisation models.

Key Results & KPIs
*Illustrative PowerTwinX targets.